When selecting a financial advisor, the total cost of fees is often obscured by layers of internal expenses and platform charges. At First Shelbourne, I believe that transparency is a prerequisite for trust. This page outlines the differences between First Shelbourne's low-cost model and the traditional national franchise model that many individuals currently use.
Most investors at large national firms are subject to three distinct layers of costs that can significantly erode long-term wealth:
Total Estimated Cost Drag: In a traditional franchise environment, the "all-in" cost to the investor can frequently exceed 2.00% annually.
Industry average fee of 1.02% is based on the 2025 AdvisoryHQ and Kitces Research studies for a $1 million portfolio. Mutual fund fees and platform fees may vary across advisors. Lower fees do not guarantee higher investment returns.
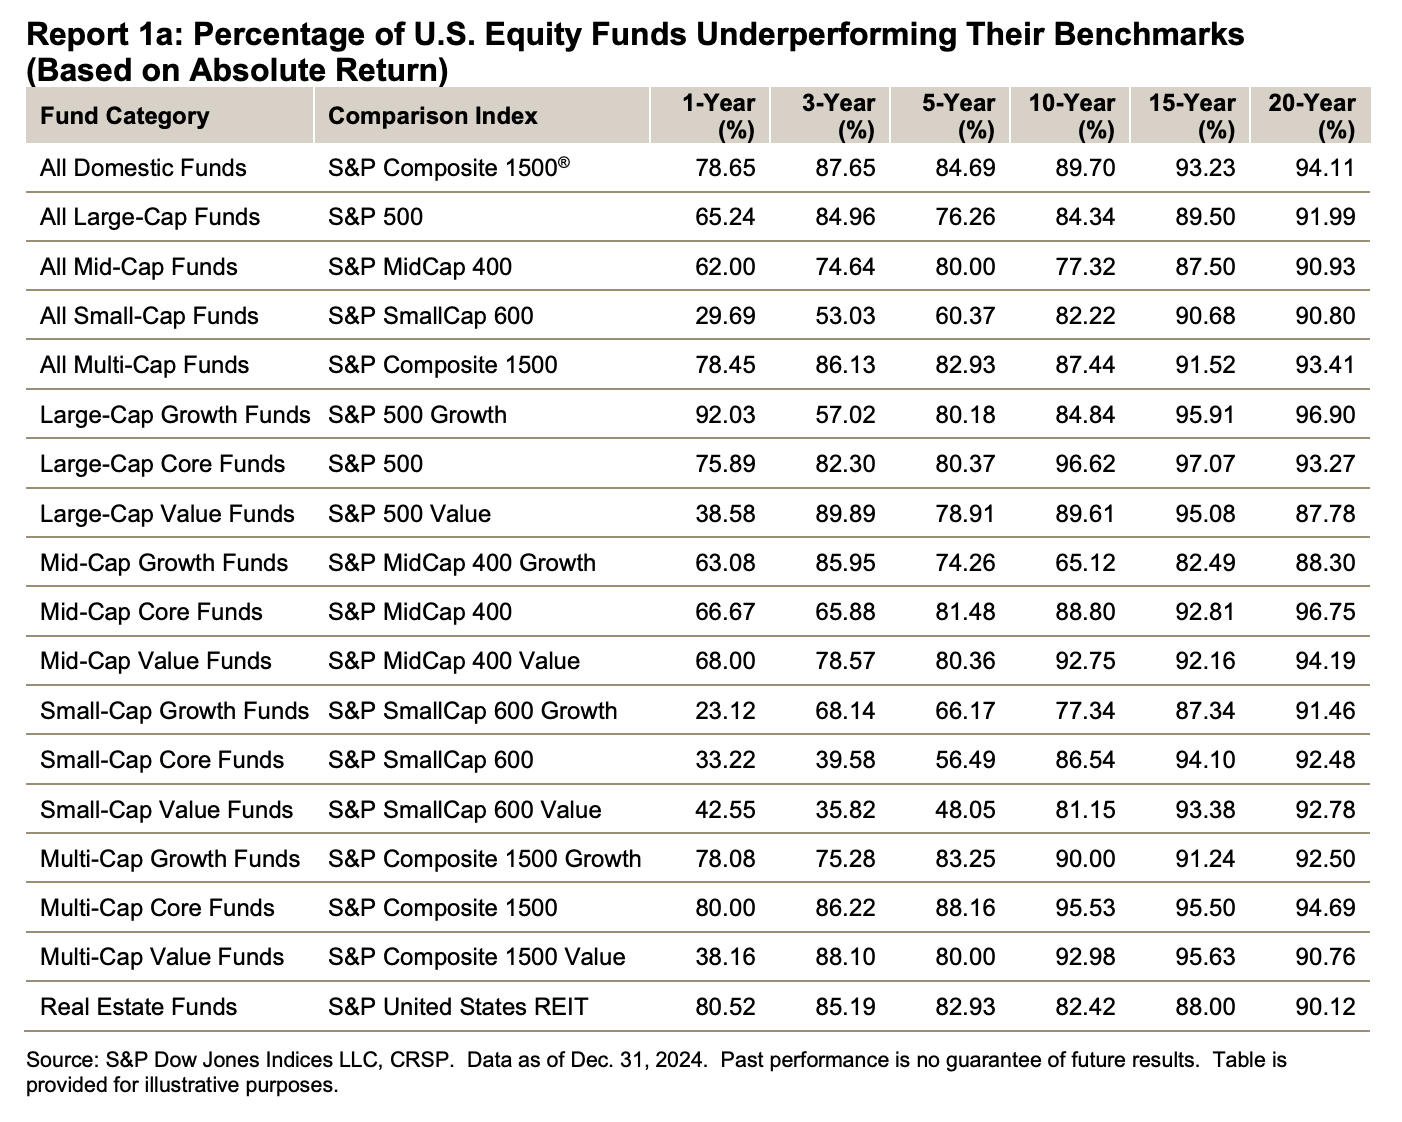
A primary justification for high-fee active management is the promise of "beating the market." However, empirical data consistently refutes this.
According to the S&P Indices Versus Active (SPIVA) Scorecard, which tracks the performance of active fund managers against their respective benchmarks:
The evidence suggests that after accounting for high internal fees and taxes, the vast majority of high-cost active funds fail to provide the value necessary to justify their expense.
First Shelbourne was established as a fully independent firm specifically to eliminate these corporate layers. My model is built on low-cost efficiency and fiduciary transparency. One has to ask themselves, if active managers as a whole are underperforming their benchmarks, and the active funds have a much higher expense ratio attached to them, then why are advisors placing client funds into these underperforming high-cost assets? The answer is quite simple: Revenue sharing agreements.
Revenue‑sharing agreements are side deals between product manufacturers and large brokerage or franchise firms in which mutual fund and annuity companies quietly pay the firm a slice of the fund’s internal expenses in exchange for “shelf space” and sales support. These payments can take the form of 12b‑1 fees, platform fees, or marketing allowances that are built into the ongoing fund expense ratio, so the cost is ultimately borne by the client even if it never appears as a line item on their statement.
In practice, revenue‑sharing creates a powerful incentive for a captive or franchise advisor to favor the funds that pay their firm the most, rather than the lowest‑cost, most appropriate funds available in the marketplace. The result is that both the advisor and the parent firm can earn more, while the client quietly pays higher all‑in fees and receives no additional benefit in return.
Sources and notes: Estimates reflect typical ranges reported in third‑party research and industry surveys for U.S. investors as of 2024–2025 (including SmartAsset and custodian fee studies for advisor fees, consumer and actuarial analyses for insurance and annuity costs, and private‑fund research for private credit). Actual fees and expenses vary by product, provider, and client situation. These figures are provided for general education and illustration only and are not a guarantee of any specific product’s cost or performance. Lower fees alone do not ensure better investment results.
Fee Category | National Franchise Average | First Shelbourne |
|---|---|---|
Direct Advisory Fee | 1.02% | 0.50% |
Platform / Admin Fees | 0.15% - 0.25% | $0.00 |
Investment Expense Ratios | 0.60% - 1.00% | 0.03% - 0.09% |
Total Estimated Drag | ~1.77% - 2.27% | ~0.53% - 0.59% |
National averages based on 2025 AdvisoryHQ and Morningstar fee studies.
By utilizing a curated selection of Index ETFs, I provide clients with broad market exposure while keeping internal costs at a minimum. These ETFs, managed by leading institutional providers, carry expense ratios as low as 0.03% to 0.09%. This ensures that the vast majority of your investment returns remain in your account, rather than being diverted to fund companies or corporate overhead. When this is added to First Shelbourne's stated advisor fee of 0.50%, the cost difference between this company and the typical franchise firm becomes extremely wide.
As investors become more educated on the impact of fee-drag, they are increasingly seeking out firms that disclose costs upfront. I believe that a firm's refusal to list its fees on its website is a significant indicator of its alignment with its clients.
At First Shelbourne, I offer one of the lowest fee structures in the industry because I have removed the "corporate tax" found at large firms. I answer only to my clients, providing institutional-grade management with no hidden agendas.
Disclosure
First Shelbourne is a Registered Investment Adviser. Advisory services are only offered to clients or prospective clients where First Shelbourne and its representatives are properly licensed or exempt from licensure. Past performance is no guarantee of future results. All investment strategies involve risk of loss. Comparison data is for illustrative purposes only. The "National Franchise" data represents a hypothetical average based on industry research; actual fees at other firms may vary. Index ETFs are subject to market risk and are not guaranteed to outperform any benchmark.
© 2026 First Shelbourne LLC, All rights reserved.
First Shelbourne LLC is a registered investment advisor in New York. Financial advisor services are offered through First Shelbourne LLC, an investment advisory firm domiciled in the State of New York. The presence of this website on the Internet shall not be directly or indirectly interpreted as a solicitation of investment advisory services to persons of another jurisdiction unless otherwise permitted by statute. Follow-up or individualized responses to consumers in a particular state by our firm in the rendering of personalized investment advice for compensation shall not be made without our first complying with jurisdiction requirements or under an applicable state exemption. This material is provided for informational purposes only and is not intended to be relied upon as a forecast, research, or investment advice, and is not a recommendation, offer or solicitation to buy or sell any securities or to adopt any investment strategy.
Form ADV | Disclosure | Terms | Privacy